
Image libary
The WINS50 Image library consists of a collection of preprocessed figures. The aim of the Image Library is to facilitate the accessibility of the dataset. All figures are derived directly from the publicly available data files that can be obtained via the KNMI Data Platform.
Currently, the image library provides four different types of plots:
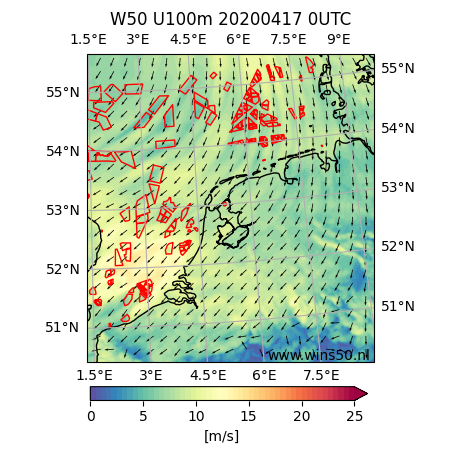
- Instantaneous snapshots of wind speed and power production
- Composite maps of wind speed, temperature and humidity at multiple levels
- Probability of exceedance of specified wind speed velocity deficits
- Frequency distributions of 100-m wind speed
- Daily snapshots of the 100m wind field (0 and 12 UTC) for the year 2020.
- CTL (Control simulation, without wind farms).
- W20 (Simulation with operational capacity).
- W50 (Simulation with hypothetical 2050 capacity scenario).
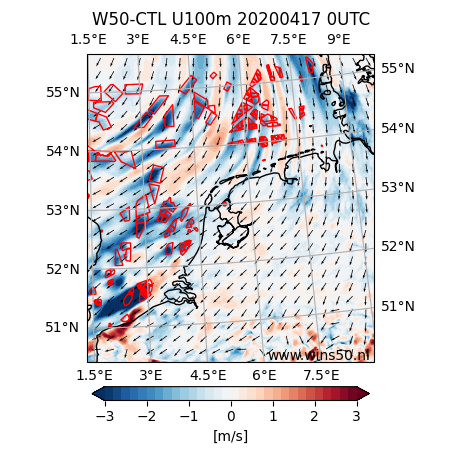
- W50-CTL and W20-CTL (Instantaneous difference plots). Differences occur due to wind farm wakes but also as a result of small timing/development differences between the two simulations (mainly in convective conditions with 'patchy' wind patterns.
- W50 Power and W20 Power. Daily instantaneous power production at 0 and 12 UTC. Production numbers are normalized by the rated power production per grid cell. As such, values vary from 0 to 1.
 |
|
Two examples of snapshots. Left: 100 meter wind field for 17 April 2020, 0 UTC, for the 2050 scenario. Right: difference in 100 meter wind speed between the 2050 scenario and the control simulation.
Image: WINS50.
- Illustrates how wind farm wakes depend on wind direction.
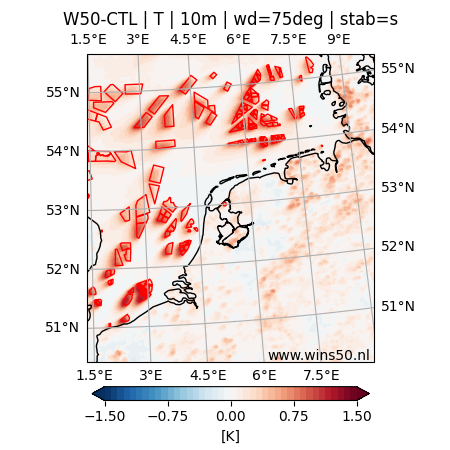
- Illustrates how wind farm wakes are influenced by stability.
- The maps show the difference between the 2020 scenarion and the control simulation (W20-CTL) and between the hypothetical 2050 scenario and the control simulation (W50-CTL).
- Plots are available for 30-degrees wide wind bins of the local 100 m wind direction.
- Data are stratified into stability classes based on thresholds of the bulk Richardson number between 100 and 10m for a representative location in the North Sea. Three classes are defined: the 33.3 most unstable cases (u), the 33.3% most 'neutral' cases (n), and the 33.3% most stable cases (s). Also, plots including all stability conditions are presented (all).
- Classification is done for each gridpoint separately, but using the same theshold values for stability. For classifying into wind direction bins, the local wind direction is used.
- For wind speed, temperature, and specific humidity.
- Heights of 10, 100, 200, 500m.
 |
|
Two examples of composite maps. Left: mean difference in 100 meter wind speed between the 2050 scenario and the control simulation for a 30 degree wind direction bin around 135 degrees (all data). Right: mean difference in 10 meter temperature between the 2050 scenario and the control simulation for a 30 degree wind direction bin around 75 degrees for the 33% most stably-stratified conditions
Image: WINS50.
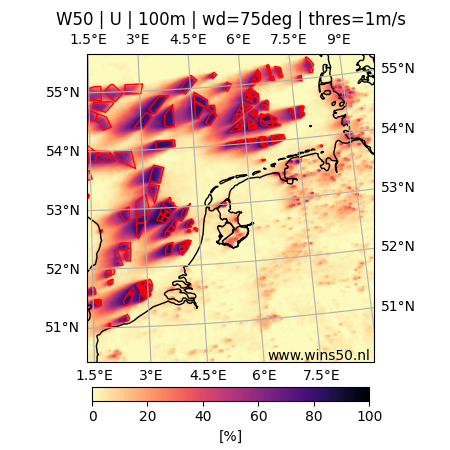
Probability of exceedance of specified wind speed velocity deficits:
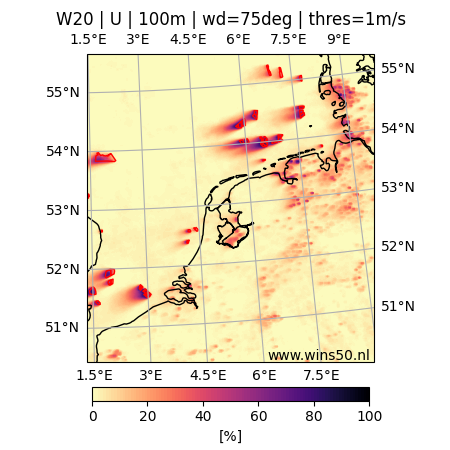
- Gives percentage of time for which a specific wind speed velocity deficit is exceeded.
- For the 2020 scenario (W20) and the hypothetical 2050 scenario (W50)
- Results for velocity deficits of 0.25, 0.5, 1.0, 2.0, 3.0, and 4.0 m/s are presented.
- A basic correction to filter out the influence of randon noise (e.g. phase differences between the scenarios) is applied.
- Plots are available for 30-degrees wide wind bins of the 100 m wind direction.
- Heights of 10, 100, 200, 500m.
 |
|
Two examples of exceedance-over-threshold maps. Left: frequency of occurrence (in %) of a velocity deficit larger than 1 m/s for the 100 meter wind speed for the 2020 scenario for a 30 degree wind direction bin around 75 degrees. Right: frequency of occurrence (in %) of a velocity deficit larger than 1 m/s for the 100 meter wind speed for the 2050 scenario for a 30 degree wind direction bin around 75 degrees.
Image: WINS50.
Frequency distributions of 100-m wind speed:
- For the 2020 control simulation (CTL), 2020 wind farm scenario (W20) and the hypothetical 2050 scenario (W50)
- For every 4th grid point of the HARMONIE model grid (so every 10 km)
- Limited to offshore locations
- Grid points can be selected via a clickable map that includes the wind farm boundaries
- The indicated ix, iy values correspond to the timeseries datafiles available at the KNMI Data Platform
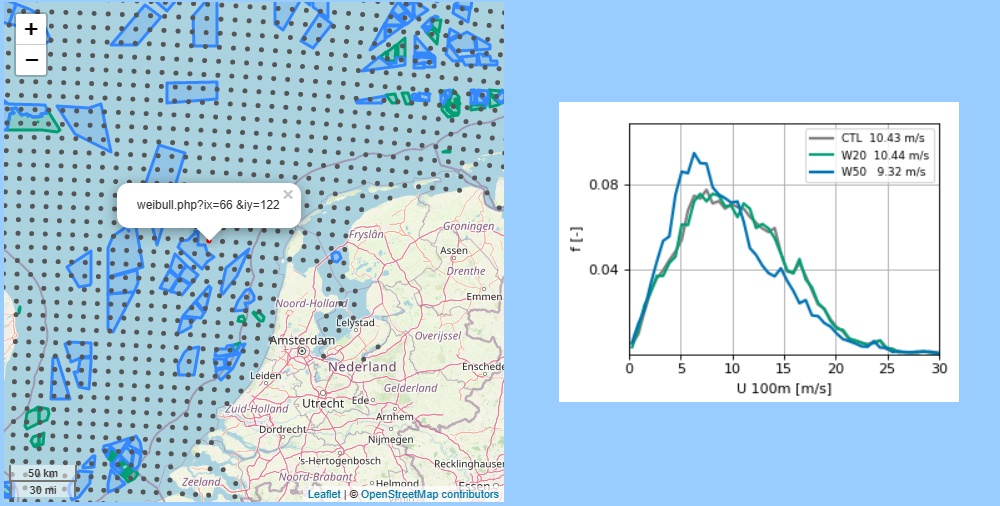 |
Left: Screenshot of the clickable map. Grey dots indicate locations for which 100-m wind speed frequency distributions are available. Right: example of 100-m wind speed frequency distributions for a selected location.
Image: WINS50.